Force Mode allows the imaging of forces between the tip and surface, including chemical bonds, electrostatic forces, surface tension and magnetic forces. In TappingMode, you can observe forces by measuring changes in tip RMS amplitude, phase, or TM deflection. The user may collect force plots in one of two forms: Force Plot and Force Volume. The two forms are similar, with Force Volume generating a map of many individual force plots. To produce high-quality force plots, it is necessary to precisely control tip position relative to the surface.
Uses of Force Calibration in TappingMode include:
When performing a force plot in TappingMode, the piezo moves to the center of the current XY scan, then turns off the XY scan motion. Next, a triangular waveform is applied to the Z electrodes of the piezo tube. This moves the oscillating tip down then up relative to the sample. The same Z-axis piezo motion occurs in Contact AFM mode force plots, however, in TappingMode, the force plot is a graph of the piezo’s extension versus oscillating tip amplitude, phase, or TM deflection, instead of deflection or friction.
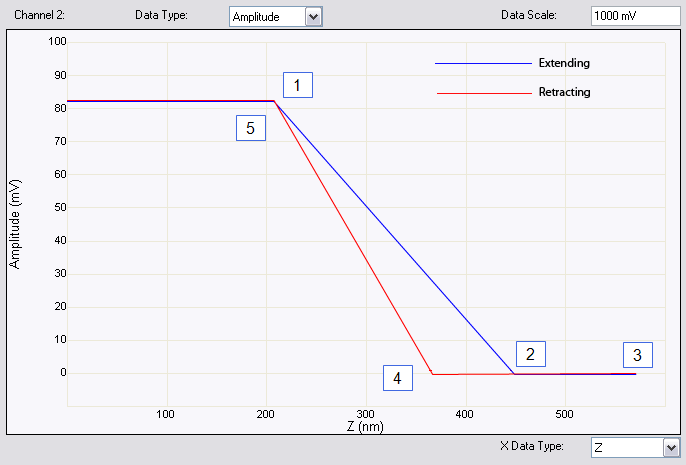
For example, as the oscillating tip is brought closer to the surface, tip motion is dampened, which shows as an immediate drop in amplitude. When plotted, the graph resembles figure 1, below. A force plot can capture more than one channel.
Figure 1 shows a TappingMode force plot in which the vertical axis represents the amplitude of the cantilever oscillation and the horizontal axis indicates the position of the Z piezo:
Figure 1: TappingMode force plot of amplitude versus Z motion
The graph above demonstrates how the cantilever amplitude decreases as the tip moves closer to the sample. The plot represents the amplitude for one complete extension-retraction cycle of the piezo. The Scan Rate parameter in the Ramp Parameter List defines the rate at which the piezo completes an extension-retraction cycle; therefore, the rate at which new curves display.
Collecting a force plot on a hard sample and dividing the change in amplitude by the change in Z piezo position gives the responsiveness of the electronics that measure the amplitude. The Amplitude Sensitivity value in the Ramp menu is the inverse of the responsiveness. You can determine this value by using the mouse to drag vertical markers from the edge to between points 1 and 2 (where the tip amplitude dampens) then selecting Ramp > Update Sensitivity.
Figure 2 shows a TappingMode force plot in which the vertical axis represents the TM deflection signal of the cantilever and the horizontal axis indicates the position of the Z piezo:
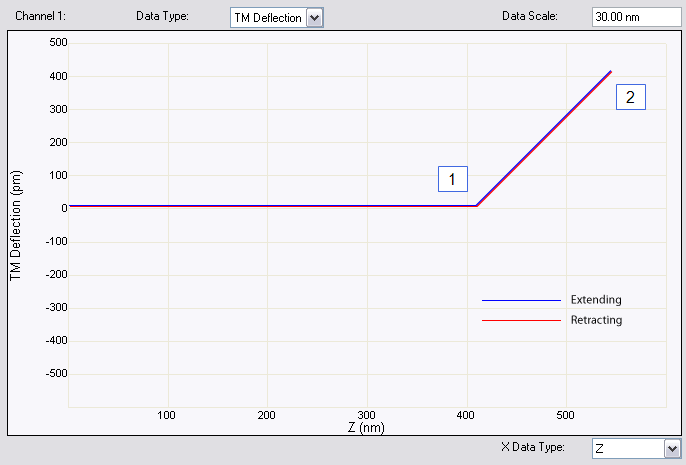
Figure 2: TappingMode force plot of TM deflection versus Z motion
The deflection signal is low-pass filtered to eliminate the high-frequency TappingMode oscillation. Even as tip RMS amplitude dampens during its encounters with the sample surface, the average deflection is unchanged. This condition changes once the tip is so close to the sample that all oscillation ceases. Extending the piezo still further causes the average deflection to increase, applying an increasing force to the sample.
At point 1 the cantilever begins to deflect. The region between points 1 and 2 may be hazardous to the tip, because the tip is pressed firmly against the sample surface. Most single crystal silicon TappingMode tips rapidly become dull in this region, depending upon the hardness of the sample.
| www.bruker.com | Bruker Corporation |
| www.brukerafmprobes.com | 112 Robin Hill Rd. |
| nanoscaleworld.bruker-axs.com/nanoscaleworld/ | Santa Barbara, CA 93117 |
| Customer Support: (800) 873-9750 | |
| Copyright 2010, 2011. All Rights Reserved. |
 Related Topics